Dumbbell Plot
geom_dumbbell.RdLine plot with two points at each end representing different values.
Usage
geom_dumbbell(
  data = NULL,
  mapping = NULL,
  show.legend = NA,
  inherit.aes = TRUE,
  position = "identity",
  na.rm = FALSE,
  colour_x = NULL,
  colour_xend = NULL,
  size = NULL,
  linewidth = NULL,
  colour = NULL,
  ...
)

GeomDumbbellArguments
- data
Dataframe.
- mapping
Requires following aesthetics: x = starting point, xend = ending point, y = category/factor.
- show.legend
Boolean.
- inherit.aes
If TRUE combine with default mapping at the top level of the plot.
- position
Default set to "identity".
- na.rm
Boolean to remove NA values.
- colour_x
Color of starting point.
- colour_xend
Color of ending point.
- size
Size of points.
- linewidth
Line thickness.
- colour
Line color.
- ...
Other args, man.
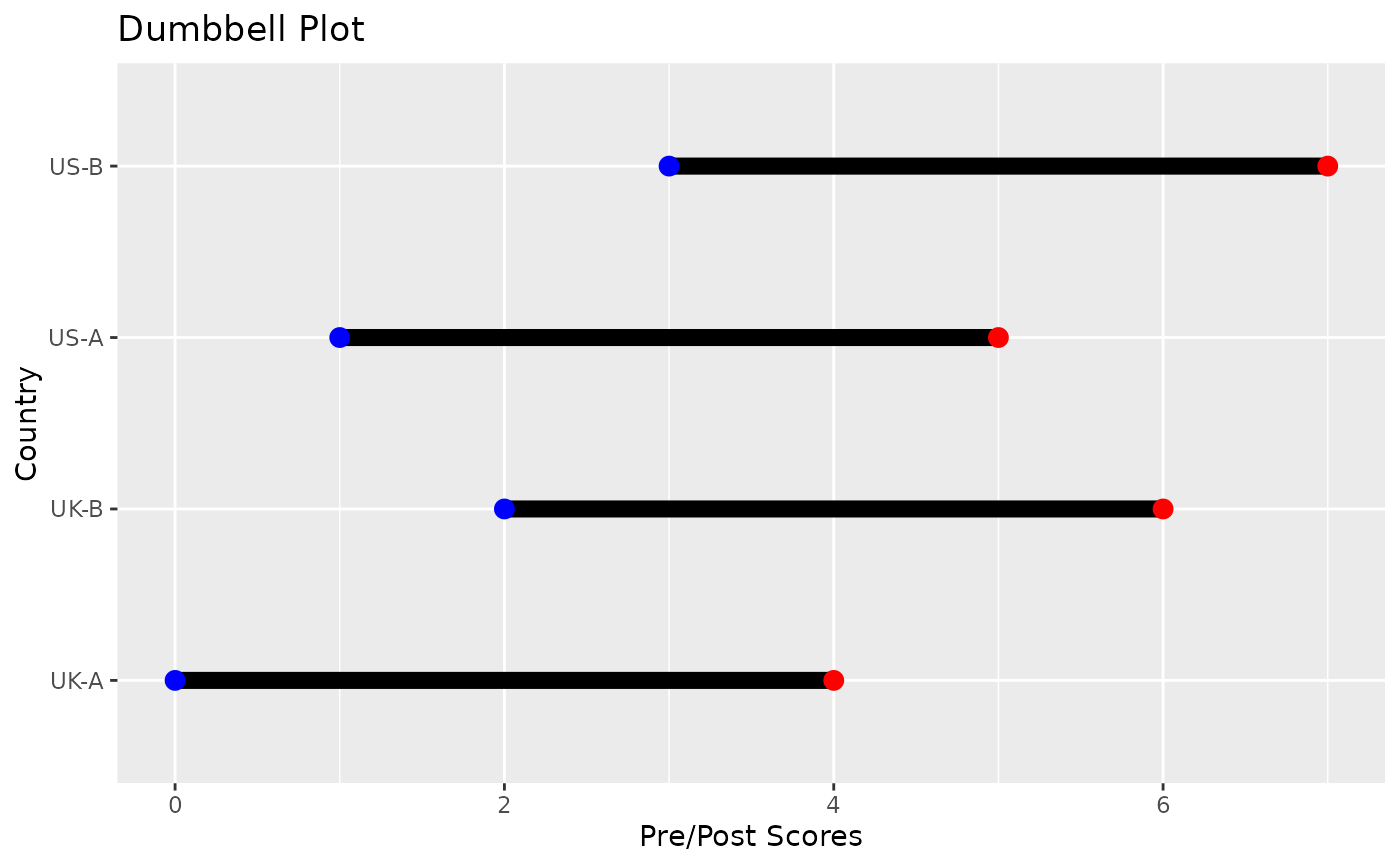
Examples
library(ggplot2)
df <- data.frame(Country = c("UK-A","US-A","UK-B","US-B"), PRE = c(0,1,2,3), POST = c(4,5,6,7))
ggplot(data = df, aes(x = PRE, xend = POST, y = Country)) +
 geom_dumbbell(colour_x = "blue", colour_xend = "red", size = 3, linewidth = 3, colour = "black") +
 labs(title = "Dumbbell Plot", x = "Pre/Post Scores", y = "Country")