Highlight Geom Using Expression
highlight_geom.RdHighlight a bar, point, or line plot based on an expression.
Examples
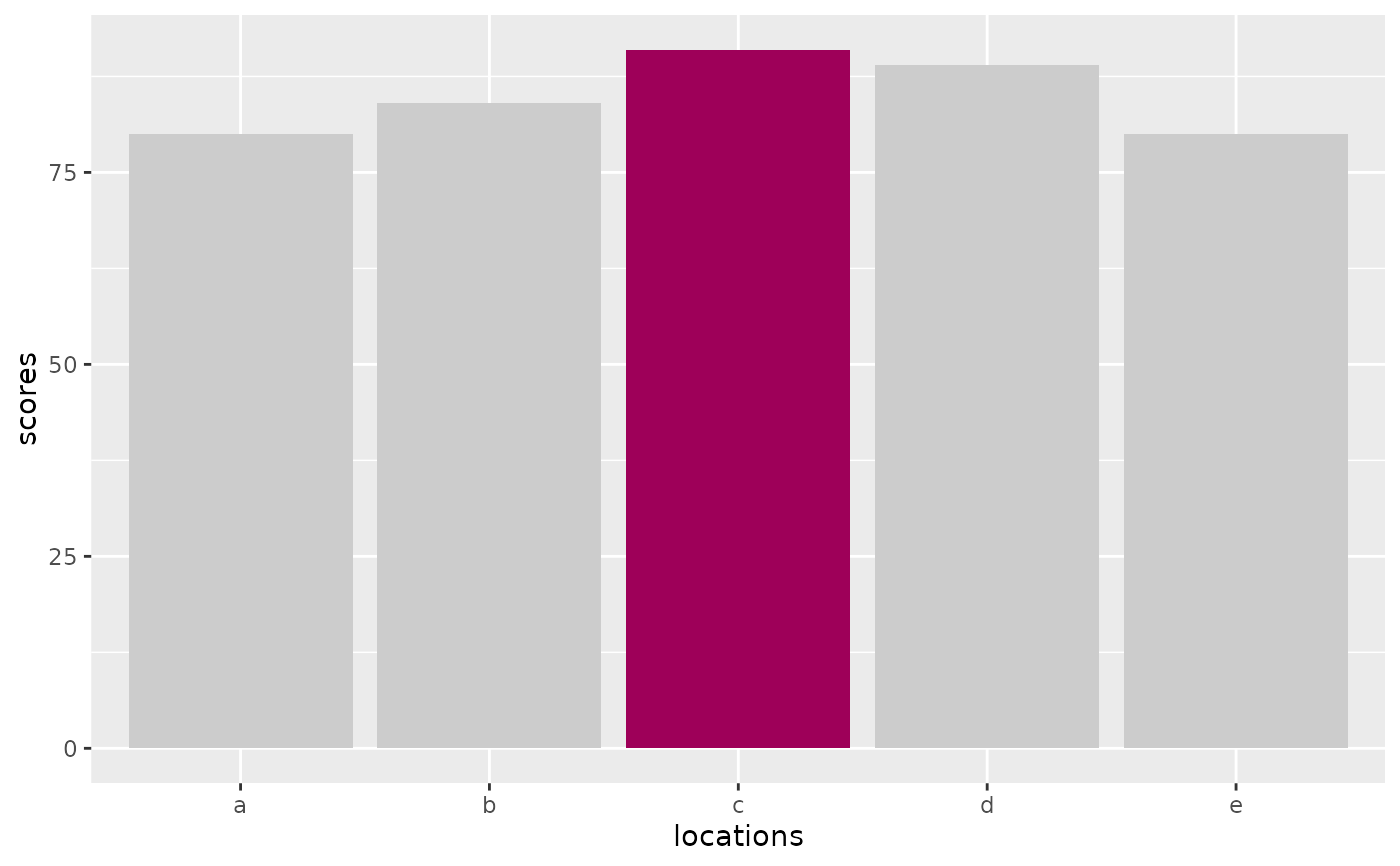
df <- data.frame(locations = letters[1:5], scores = c(80,84,91,89,80))
ggplot(data = df, aes(x = locations, y = scores)) +
geom_col() +
highlight_geom(scores==max(scores), pal = "#9E0059")